
[This is a Guest Diary by Paul Olson, an ISC intern as part of the SANS.edu BACS program]
Introduction
Starting my internship with SANs Internet Storm Center [1] was daunting from the aspect of being unsure of what to expect. Over the years I’ve completed several SANs courses and have become comfortable with that experience; there is a flow to the courses and the SANs instructors exceed my expectations. In this respect, the ISC Internship is a completely different animal; it presents a more hands-on learning opportunity, requires more self-reliance, and provides a greater element of unpredictability than I have found in SANs course labs. With more of the Internship work behind me than in front of me I can say that I have gotten more out of this internship than I have from other similar experiences.
Some of my concerns were about the ‘unknown unknowns’ [2]. Setting up the DShield honeypot [3] was straightforward exercise; my biggest worry was meeting the objectives of the Internship. Over the years that I have had broadband Internet I have periodically reviewed the logs generated by my home firewall. The firewall logs didn’t provide a wealth of information (event time, source and destination IP, protocol and ports involved, etc.). My concern became “How am I going to produce seven attack observation reports out of this? Who is going to bother with this device connected in a basement to a broadband network in North Dakota, US?”.
As it turns out that wasn’t going to be an issue. This newly-minted honeypot was remotely interacted with over 1,600 times from 169 distinct IP addresses on the first day; the device currently averages 17,000 probes daily. Reviewing the honeypot logs, one of the first lessons I learned from the Internship is that there are vast differences between a single-dimension firewall log and the level of detail in the data the honeypot captures when it is probed.
The next challenge was to make some sense of the data and figure out where to begin my analysis. As I started to dig in, I used tools mentioned in recent SANs classes or in ISC diary entries. That list includes jq, python, bash, command-line tools such as grep/egrep, sort, awk, PowerShell, some web-based Json-to-csv parsers [4] [5], VirusTotal [6], Joe Sandbox [7], Shodan [8], Mitre ATT&CK [9], and Microsoft Excel. I have learned how to use the tools (and a little on how not to use the tools) to analyze and understand various command sequences. Lately I have been working with Python to filter the data and isolate records of interest. That data is loaded into an Excel spreadsheet for analysis, tables and graphs are created to help visualize the event. I can use the graphs when I create my report.
The next part of the puzzle was to figure out how to efficiently utilize those tools. What am I looking for? What is that next question I should ask? While reviewing log data to identify an interesting set of logs to investigate I found that the ‘Five Ws’ (Who, What, When, Where, Why, How) approach [10] helped organize my investigation. Answering those questions provided direction and led to asking more useful follow-up questions. I found that often these ‘W’ questions will be asked in an order that will organically develop based on how each investigation unfolds. This methodical approach is one that helps me save time and produce a better analysis of the events. I have found that I often ‘loop back’ to re-ask earlier questions because the answer to some other question provided more clarity or insight. This analysis process is an iterative exercise.
The remainder of this blog post is largely a narrative of a recent event sequence I found in my logs. As the events unfold in the following sections of the document, I will add some commentary about the process I followed. I start with the ‘W’ questions, and the answers sometimes point to the next step in the process.
Who | What | When | Where | Why | How | How Long
The honeypot always receives many Telnet/SSH probes, but a series of events appeared that followed a distinct pattern. This is the identification of the incident, this is the ‘what‘ that is happening.
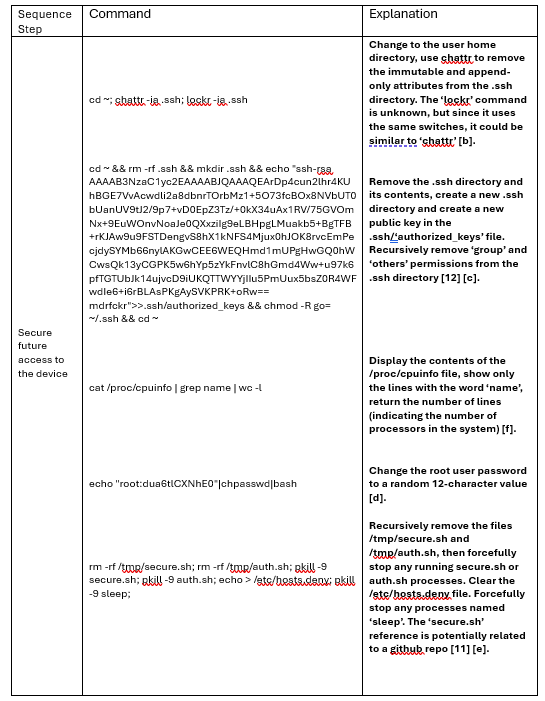
At a high level, the sequence I started investigating was:
The actor authenticates to the system using a username/password using the root account [a] [j].
Several commands are executed by the actor to secure access to the device [b].
Remove the existing .ssh directory and contents, then create a new public key to enable certificate-based authentication [c].
Change the root account password to a random 12-character value [d].
Recursively removing the files /tmp/secure.sh [11] and /tmp/auth.sh [e].
The actor launched various commands to profile the system/hardware [f].
Analyzing the command sequence can help us shed some light on the goal of the attack. For this series of events the commands used (after authenticating to the honeypot via SSH) were:
The next step (not captured by the honeypot but identified through research) would be for the actor to upload a file named dota3.tar.gz via SFTP [13]. The actor would execute base-64 encoded command to initialize the malware. Assimilation complete [14] [e] [g] [h] [i].
Who | What | When | Where | Why | How | How Long
Since I had a fair amount of information about the command sequence I next tried to identify the actor. I treated the construction of the key string used to replace the .ssh/authorized_keys file that was placed in the system to gain persistence as an IoC (Indicator of Compromise) [c] [12]. This IoC matched attacks attributed to the ‘Dota’ family of botnets. The Dota botnet targets IoT devices running SSH servers that use default or poorly chosen passwords. Once the actor gains access to the device they begin to profile the system, followed by uploading and executing malware on the device to add it to the botnet [i]. The Firm CounterCraft has internally labeled this actor as ‘CC0631’ [13], but at the time of this writing the actual identity of the threat actor has yet to be determined.
Who | What | When | Where | Why | How | How Long
We can summarize the Why of this attack as a desire to ‘assimilate’ this device into a botnet army. Once the actor has assembled their army, we can only assume that they will use it for future (malicious but money-making) activities, such as crypto currency mining, DDOS attacks, spam distribution, data theft, etc. The Dota3 botnet has been linked to crypto jacking [15], deploying the XMRig [16] agents to compromised systems, indicating that the purpose of the botnet is to engage in crypto mining [13].
Who | What | When | Where | Why | How | How Long
Once I had something to look for, I needed to find the ‘When’, or the period between the first and last detected instances of this attack sequence in the logs. This will help me get my arms around the data I need from the event to produce a more complete analysis. I continued to find instances of this attack sequence as I searched through older log files. In my honeypot I was able to set the start date to 10 June 2024 and the end date to 11 August 2024 (the date I was doing my analysis; these attacks continue to this day). This would reflect my local ‘How Long’ period as well, at least from my honeypot’s perspective. Knowing this date range is a key detail necessary to identify the scope of the activity.
Who | What | When | Where | Why | How | How Long
The earliest mention that I can find is that this variant of the Dota botnet was detected in December of 2019 [17], but there are conflicting reports with other sources listing an October 2021[13] identification date. Not a conclusive answer, but in this case the How Long for this botnet’s existence could be between 3 and 5 years.
Who | What | When | Where | Why | How | How Long
The next steps are to continue analysis of the data to gain more understanding about the scope and scale of the operation and try to identify aspects of ‘how’ the actor works. For instance, an interesting aspect of an incident is to understand if this is a manual process or if it is automated.
There are a few attributes of an attack sequence that can help with this identification, namely:
The Volume or rate of activity occurring in a window of time,
The Geographic locations of attacking systems (analyze the involved IP addresses, locations, reuse), and
The Session Time or the length of an attack session compared to the complexity of the commands.
From my perspective, my local ‘When’ and ‘How Long’ attributes allowed me to identify activity from over 10,000 probes. The logs showed 42% of the probes were initially unsuccessful. This activity resulted in a total of 5,873 successful SSH authentications to the honeypot that fit the same subsequent command sequence. Crunching the data (i.e., I used Python to isolate the data elements, Excel to do the math and create the graphics), the following attributes can be identified:
Volume: The volume / rate of successful authentications during the period of 10 June to 11 August (62 days) would be 5,873/62, or 94.73 incidents per day (one every 4 hours).
Another way to evaluate the event frequency is to identify how many occur during a given hour over a period of time. Think of each hour as a bucket, and for each day add the number of attacks for that hour to that ‘bucket’. (This type of analysis is often used to analyze network traffic to identify potential ‘beaconing’, or command and control activity.) For this attack, after 62 days the hourly event distribution graph looks like:
For example, as shown in the chart above, the peak hour across the date range was 16:00UTC with 399 successful authentications, the ‘slowest hour is 22:00UTC with 131 authentications, and the average hourly event rate approaches 245. This trend indicates a 24×7 operation.
These findings (overall rate of attack and rate of attack per hour) are indications of an automated operation.
Who | What | When | Where | Why | How | How Long
Geographic Location: Next, I worked to find the number of systems used in the probe- and the country in which they are hosted. The successful probes originated from 2,464 IP addresses in 94 different ISO codes. This is another sign of an automated operation. As listing all 2,464 distinct IP addresses in this document would not be useful, this table shows the top 20 IP addresses by number of successful authentications from that address:
The data in the table above tends to show a distributed event due to the number of IP addresses used and the geographic range (ISO codes (countries)) over which the addresses are hosted. Many of the IP addresses appear only once in my honeypot logs. This is displayed graphically in the chart below (#IP addresses in the ‘Y’ axis vs # times used in the ‘X’ axis):
I mentioned earlier that the probes originated from 94 different ISO codes (countries) [18]. The table below displays the top 20 hosting countries. The countries in this list hosted the systems responsible for 88% of all attack sessions:
Excel has many graphs to help display and convey information visually. I tried and rejected different attempts, including bar charts, line charts, and the usually reliable pie chart. I found that I could not clearly convey this information using those standard charts. Thinking about the worldwide aspect of this dataset led me to try to figure out how to create a graph from a map. Three minutes with a search engine [19] and another four minutes with Excel helped create this suitable-for-framing chart that helps illustrate the global nature of the attacks:
Of the 249 countries, territories, or areas of geographical interest [18] with ISO codes, 38% show up in my dataset and are highlighted in the chart above.
Session time: The approach I took was to analyze the amount of time each attack took from the point of authentication to the end of the command sequence. The session time is easy to calculate, but I also wanted to obtain a measure of the amount of work completed by the actor during each session. A lot of keypresses during a short amount of time would indicate that there is automation being employed. There are some practical challenges with this approach that I will call out below.
Session Time = Session end time – Session start time in seconds (s)
Command sequence: 1103 characters (c) (13 logon + 1088 ‘command’ characters).
From a worldwide perspective
The average session time was 18.49s
Maximum session time of 182.5s, Minimum length of 6.1s.
1103c / 18.49s per session = 59 cps (characters per second)
59cps ~= 720 words per minute
From a US-based IP address:
The average session time was 14.19s
Maximum session time of 112.2s, Minimum length of 6.1s
1103c / 14.19s per session = 74 cps
74 cps ~= 888 words per minute
In graphical form (using Excel) the difference between the US-based attacks and worldwide attacks is displayed below; you can nearly see the US average of 14.19s in the chart on the left vs the world average of 18.49s in the chart on the right as a virtual horizontal line denoting those averages in each graph:
As noted above, this process is not entirely accurate; there are external factors that impact the measurement. For instance, the amount of time it takes for the honeypot to process and respond to the command, the processing capacity of different source devices, and the variability in the network ‘speed’ between the actor and the victim are not taken into account with this process.
Leaving those issues aside for a moment, these results still show that the attacks were automated; the data shows the ‘typist’ was working at speeds exceeding 720 words/minute. If the three impacting factors mentioned above are taken into account, the typing rate (in words per minute) would increase.
The conclusion drawn (from a Volume, Geographic Dispersion, and Session Timing perspective) also supports a conclusion that this is an automated activity. The scale of the event (number of IP addresses, number of host countries) further indicates that this is likely a botnet operated by a threat actor group; it would take more effort to collect and maintain a fleet of bots this size than one person could be expected to support.
Other interesting aspects of the event I decided to investigate are the accounts targeted, the variety in the types of passwords used to authenticate, and an analysis of the new passwords used to secure the root account.
In this case, the event targeted the root account most often (99.5%) [j]. A small number of user accounts were targeted by the actor at a much lower rate:
‘roots’,
‘root1’,
‘root2’,
‘webroot’, and
‘root01’.
While probing the system the actor used 1,314 unique passwords to authenticate using SSH [a]. Passwords were often reused when trying to initially authenticate, only 229 passwords were used one time. This activity is consistent with an organized password-spray attack, using one password to try authentication against multiple targets in one ‘pass’ [k]. The password re-use graph (below) matches the general form of the IP address graph presented above; the number of reused passwords (‘Y’ axis) decreases with the number of usages (‘X’ axis):
The fourth step in the command sequence was an attempt by the actor to gain persistence on the device by changing the password of the system account to a new value. Of the 5,873 password changes to the ‘root’ user account, 5,759 passwords were unique, re-using only 119 passwords. The new password values had the same format; all were 12-character strings consisting of random uppercase, lowercase, and numeric characters [d].
Attack Observation Report Generation
At this point, all ‘W’ and follow-up questions have been identified, asked, and answered, and it is time to pull all of the collected information together to produce an Attack Observation report. This report includes a summary of observations using text, tables, and graphs (actor info, IoCs, command patterns, impact, Mitre techniques [20], proposed recovery steps) as well as information about mitigating controls that could be implemented to prevent future attacks. The report content is distilled down to ‘just the facts’, as the purpose of an Attack Observation report is to be more direct and focused than a blog post.
You may find that the process of creating an Attack Observation report will raise additional questions that must be answered to arrive at a more complete ‘picture’. This is the iterative part of the analysis process I mentioned earlier. Lather, rinse, repeat…
For this Attack Observation report
Who? – This command pattern has been reliably attributed as belonging to the ‘Dota3’ botnet [21], and the CounterCraft company has labeled the actor ‘CC0631’ [13], but very little about this threat actor is known at this time [i].
What? – The Dota3 botnet targets SSH servers with weak credentials. The goal is to compromise the system, obtain persistence, and install malware on the device for malicious activities such as crypto mining of digital currency [17] [a] [b] [c] [d] [e] [f] [g] [j] [k].
Where? – This is a global event. 5,873 successful authentications/probes over 62 days using 2,464 distinct IP addresses (systems) hosted in 94 different countries. The scope and scale of the operation indicates that this is controlled by a threat group. General botnet activity is also on the rise globally [22] [i].
When? – The events started on 10 June 2024 and data through 11 August 2024 is included in the report.
Why? – The ‘why’ is to specifically identify weak SSH servers, gain root access, obtain persistence, and install malware. There are indications that this activity is related to mining crypto currency (crypto jacking) [13] [23] [h] [i].
How? – Is this an automated event, or is this a one-off manual effort? To get this answer I review the various rates of attack, identify the locations participating in the probes, and inspect the different commands used. This can help identify if this is an automated event or not and can also potentially shine a light on the actor. Additionally, mitigating steps can be identified to block or deflect the malicious traffic. This activity was characterized as an organized, automated attack.
How Long? – Research uncovered that the Dota3 malware variant has been active since at least October of 2021 [13]; there are reports that move that date back to as early as December of 2019 [17]. Conservatively, the variant has been active for 3 years. As of this writing these attacks are still targeting my honeypot.
Prevention: Botnets will exist as long as the actor’s efforts:
are financially lucrative,
remain technically possible, and
are not derailed by the incarceration.
The operation of a botnet would be affected if one of those three items is changed.
The information collected in this Attack Observation report can be used to prevent or to reduce the technical feasibility of future attacks.
A list of potential controls could be compiled and provided to the company’s IT Architecture, Design, and Implementation teams to help them build preventative measures into projects. Future systems and services will be deployed with a more secure architecture and configuration.
Methods to detect a compromised device would be extremely useful as well; Security Operations staff could employ that information to identify, contain, and eradicate malicious actors from the company’s systems.
Additionally, the company’s GRC (Governance, Risk, and Compliance) team can use these findings when reviewing the company’s control library, either adding new controls or ensuring that existing controls are applied where appropriate. Future audits can be completed to help the company manage operational risk.
Conclusion: This is a preventable attack. Systems with strong password controls would not be susceptible to this activity. If we were in a corporate environment, the next steps would be to:
1. Identify security gaps.
2. Plan to evaluate all IoT devices that are accessible from the Internet.
3. Log into each device.
If you cannot log into the device, schedule a replacement or closer inspection for the system; it may be compromised.
When deploying the replacement device, ensure that it is sufficiently protected from remote authentication attacks.
If you can log into the device, implement controls to improve the configuration hygiene and secure the device.
Ensure that at a minimum the passwords are unique per device and ‘strong’ enough.
4. Repeat until complete.
5. Report findings to the appropriate groups.
6. Implement a practice to periodically audit these systems to ensure that any compromised devices are identified and recovery steps are taken.
In this case eleven security (hygiene) controls that can be implemented to reduce IoT attacks:
1. Do not expose unprotected IoT devices to the Internet. If it isn’t accessible, it can’t be assimilated.
2. Implement IoT devices behind a bastion host [24] or a firewall.
3. Restrict logon access to known IP addresses, ports, and protocols with filtering rules on the firewall or router.
4. Implement VPN access to your systems with strong passphrases and multifactor authentication.
5. Ensure that IoT systems are patched and software is up to date [25].
6. Ensure that the device has a secure configuration.
7. Do not allow privileged accounts (i.e., root) to have SSH access.
8. Do not use simple passphrases for SSH authentication, utilize public/private authentication keys with a passphrase
9. Ensure that passphrases are long and are strong (comprised of (at least seemingly) random characters).
10. Do not re-use passwords across devices.
11. Monitor IoT devices.
Summary
It is now time to close a loop and explain the title of this article (“Hygiene, Hygiene, Hygiene”).
The old joke “What are the three most important things to know about real estate? Answer: Location, Location, Location!” could be modified and applied to this situation: “What are the three most important steps to take to protect my systems? The answer to that question is: Hygiene, Hygiene, Hygiene!”. The new joke works as well as the original; the ‘corniness’ is maintained and the answer provides a hint of the solution.
In a perfect world, the ‘Hygiene’ process begins with a threat assessment, the results of which are integrated into project planning and design phases. Pilot systems are built and tested, issues are identified and solutions are fed back into the design process. During the deployment phase of the project tests are performed and systems are monitored to ensure that the product remains true to the plan. After deployment is complete, the operational system is periodically subjected to monitoring, auditing, testing, and adjustments are made as necessary. This approach is difficult, takes time, and increases project cost, which are all reasons our systems are vulnerable to botnets today.
Since we are often not in a perfect world we often must circle back and apply hardening (hygiene) changes to in-production systems. This process is not inexpensive nor easy to do, but if even a few improvements can be made the system will be less likely to fall to compromise.
There is a relationship between the answer to that original joke (i.e., ‘Location’) and a concern I had related to satisfying the requirements of the ISC Internship. I was concerned that the Internet that serviced my little corner of the world was somehow as secluded as it was geographically, which would make it difficult to complete the assignments. That has not been the case. Another valuable lesson from this experience is that there are no hidden corners of the Internet. In real life, newly connected devices are discovered within a few minutes, and poorly protected systems (i.e., low-hanging fruit) are often compromised a few minutes later.
The ISC Internship is an intensive experience. In the end, as with any meaningful undertaking, you get out of it what you put into it. I have learned a lot about configuration hygiene, IoT weaknesses, data analysis, tool development / scripting, and have a deeper appreciation for the work that goes in analyzing an incident and creating an attack observation report. I can’t think of a better way to gain this experience; this Internship provides an opportunity to roll up your sleeves and dig in.
Identified Mitre ATT&CK Techniques
[a] Mitre ATT&CK: Brute Force.Password Guessing (T1110.001) – Adversaries with no prior knowledge of legitimate credentials within the system or environment may guess passwords to attempt access to accounts. [23]
[b] Mitre ATT&CK: Command and Scripting.Unix Shell (T1059.004) – Adversaries may abuse Unix shell commands and scripts for execution. [23]
[c] Mitre ATT&CK: Account Manipulation.SSH Authorized Keys (T1098.004) – Adversaries may modify the SSH authorized_keys file to maintain persistence on a victim host. [23]
[d] Mitre ATT&CK: Account Manipulation (T1098) – Adversaries may manipulate accounts to maintain and/or elevate access to victim systems. Account manipulation may consist of any action that preserves or modifies adversary access to a compromised account, such as modifying credentials or permission groups.[1] These actions could also include account activity designed to subvert security policies, such as performing iterative password updates to bypass password duration policies and preserve the life of compromised credentials. [23]
[e] Mitre ATT&CK: Indicator Removal. File Deletion (T1070.004) – Adversaries may delete files left behind by the actions of their intrusion activity. Malware, tools, or other non-native files dropped or created on a system by an adversary (ex: Ingress Tool Transfer) may leave traces to indicate to what was done within a network and how. Removal of these files can occur during an intrusion, or as part of a post-intrusion process to minimize the adversary’s footprint. [23]
[f] Mitre ATT&CK: System Information Discovery (T1082) – An adversary may attempt to get detailed information about the operating system and hardware, including version, patches, hotfixes, service packs, and architecture. Adversaries may use the information from System Information Discovery during automated discovery to shape follow-on behaviors, including whether or not the adversary fully infects the target and/or attempts specific actions. [23]
[g] Mitre ATT&CK: System Service Discovery (T1007) – Adversaries may try to gather information about registered local system services. Adversaries may obtain information about services using tools as well as OS utility commands such as sc query, tasklist /svc, systemctl –type=service, and net start. [23]
[h] Mitre ATT&CK: Resource Hijacking (T1496) – Adversaries may leverage the resources of co-opted systems to complete resource-intensive tasks, which may impact system and/or hosted service availability. [23]
[i] Mitre ATT&CK: Compromise Infrastructure.Botnet (T1584.008) – Adversaries may compromise third-party network devices that can be used during targeting. Network devices, such as small office/home office (SOHO) routers, may be compromised where the adversary’s ultimate goal is not Initial Access to that environment — instead leveraging these devices to support additional targeting. [23]
[j] Mitre ATT&CK: Valid Accounts.Local Accounts (T1078.003) – Adversaries may obtain and abuse credentials of a local account as a means of gaining Initial Access, Persistence, Privilege Escalation, or Defense Evasion. [23]
[k] Mitre ATT&CK: Brute Force.Password Spraying (T1110.003) – Adversaries may use a single or small list of commonly used passwords against many different accounts to attempt to acquire valid account credentials.
[1] sans.edu Internet Storm Center – SANS Internet Storm Center
[2] Rumsfeld Matrix (theuncertaintyproject.org)
[3] Submit Your Firewall Logs – SANs Internet Storm Center
[4] JSON To CSV Converter (convertcsv.com)
[5] JSON to CSV – CSVJSON
[6] VirusTotal – Home
[7] Joe Sandbox
[8] Shodan Search Engine
[9] Mitre ATT&CK
[10] Five Ws – Wikipedia
[11] secure linux/secure.sh
[12] VirusTotal – File
[13] Dota3 Malware Again and Again | CounterCraft (countercraftsec.com)
[14] Assimilation | Memory Alpha | Fandom
[15] Cryptojacking – What is it, and how does it work? | Malwarebytes
[16] XMRig
[17] Dota3: Is your Internet of Things device moonlighting? | Official Juniper Networks Blogs
[18] List of ISO 3166 country codes – Wikipedia
[19] Create a Map chart in Excel – Microsoft Support
[20] Tactics – Enterprise | MITRE ATT&CK®
[21] blog.port22.dk
[22] 15+ Shocking Botnet Statistics and Facts for 2024 (comparitech.com)
[23] Global Threat Intelligence Report April (blackberry.com)
[24] Bastion host – Wikipedia
[25] A Look Back at the Top 12 IoT Exploits of 2021 (Part 1) (finitestate.io)
[26] https://www.sans.edu/cyber-security-programs/bachelors-degree/
———–
Guy Bruneau IPSS Inc.
My Handler Page
Twitter: GuyBruneau
gbruneau at isc dot sans dot edu
(c) SANS Internet Storm Center. https://isc.sans.edu Creative Commons Attribution-Noncommercial 3.0 United States License.